Market Outlook
June 23, 2017
Market Cues
Domestic Indices
Chg (%)
(Pts)
(Close)
Indian markets are likely to open flat tracking the SGX Nifty and Asian markets.
BSE Sensex
0.0
87
31,291
US markets had a flat session during yesterday’s session. Stocks benefited initially
Nifty
(0.0)
(4)
9,630
from a positive reaction to the release of the details of the plan to repeal and
Mid Cap
(0.6)
(88)
14,763
replace Obamacare. Healthcare stocks gave a strong move to the upside initially but
Small Cap
(0.6)
(87)
15,609
lost ground as the indices moved lower during the session.
Bankex
0.2
42
26,817
UK stocks were dragged lower as crude prices continued their decline, with brent
crude futures trading below $45 per barrel. Energy major Tullow Oil lost 1.6
Global Indices
Chg (%)
(Pts)
(Close)
percent, while Royal Dutch Shell and BP Plc dropped about 1 and 0.6 percent
respectively. Miners lost ground, with Glencore losing more than 1 percent.
Dow Jones
(0.1)
(13)
21,397
Nasdaq
0.0
53
6,237
Indian markets gave up gains from early in the session to close flat. Most sectoral
FTSE
(0.1)
(8)
4
7,439
indices closed in the red at the end of Thursday’s session. The biggest losing indices
Nikkei
(0.1)
(28)
20,111
for the session were the Oil & gas and the metal index. They were down 1.79 and
1.35 percent respectively.
Hang Seng
(0.1)
(20)
25,675
Shanghai Com
(0.3)
(9)
1
3,147
News Analysis
Lupin- USFDA update
Advances / Declines
BSE
NSE
IT Industry to grow at 8-9% in FY2018; Nasscom
Advances
1,107
1,623
Detailed analysis on Pg2
Declines
1,576
1,051
Unchanged
153
83
Investor’s Ready Reckoner
Key Domestic & Global Indicators
Volumes (` Cr)
Stock Watch: Latest investment recommendations on 150+ stocks
BSE
4,693
Refer Pg6 onwards
NSE
26,262
Top Picks
CMP
Target
Upside
Company
Sector
Rating
#Net Inflows (` Cr)
Net
Mtd
Ytd
(`)
(`)
(%)
Blue Star
Capital Goods
Buy
631
760
20.4
FII
(56(89)
(21,642
53,610
Dewan Housing Fin. Financials
Accumulate
457
520
13.9
MFs
8214
4,873
34,913
Mahindra Lifespace Real Estate
Buy
434
522
20.4
Navkar Corporation Others
Buy
216
265
22.5
Top Gainers
Price (`)
Chg (%)
KEI Industries
Capital Goods
Accumulate
230
258
12.1
Amtekauto
131
10.0
More Top Picks on Pg5
Jpassociat
16
7.2
Key Upcoming Events
Gvkpil
7
6.6
Previous
Consensus
Date
Region
Event Description
Reading
Expectations
Cox&Kings
284
6.3
Jun 23, 2017 Germany PMI Manufacturing
59.50
59.00
Rdel
60
5.5
Jun 23, 2017 Germany PMI Services
55.40
55.40
Jun 23, 2017 US
New home sales
569.00
590.00
Top Losers
Price (`)
Chg (%)
Jun 27, 2017 Germany Unemployment change (000's)
(9.00)
Ibrealest
192
(9.8)
Jun 29, 2017 US
Consumer Confidence
117.90
115.40
Jun 30, 2017 US
GDP Qoq (Annualised)
1.20
1.20
Videoind
18
(5.0)
More Events on Pg5
Corpbank
53
(4.1)
Justdial
393
(3.9)
Ioc
394
(3.6)
#as on 22nd June, 2017
Market Outlook
June 23, 2017
News Analysis
Lupin- USFDA update:
The US Food and Drug Administration (USFDA) issues 5 observations for Lupin's
Pithampur Unit 3. The nature of these observations is not known. As per the
Pithampur site, it is one of the Lupin’s largest formulations facility located at Indore
Special Economic Zone (ISEZ) and is about 30 Km from Indore city. This is the only
site of Lupin having capability to manufacture various finished dosage forms like
Tablets, Capsules, Ophthalmics, Dermatological Preparations, Metered Dose
Inhalers (MDI), Dry Powder Inhalers (DPI) as well as Active Pharmaceutical
Ingredients (API).
This site has 3 sub units, where:
Unit-1 is having dedicated plants for manufacturing of Oral Formulations and
Active Pharmaceutical Ingredients (API) (Manufacturing capacity
-
1 Billion
Tablet/Capsules and 30 to 140 Kg API).
Unit-2 is having dedicated plants for manufacturing of Oral Formulations and
Sterile Ophthalmics (Manufacturing capacity - 10 Billion Tablet/Capsules and 6
Million Ophthalmics).
Unit-3 is having dedicated modules for Manufacturing of Dermatological, Metered
Dose Inhaler (MDI) and Dry Powder Inhaler (DPI) Formulations (Manufacturing
capacity - Derm-6 Million units, MDI-3 Million units, DPI - 178 Million units).
While the sales impact is not know and we are currently we are factoring in the
same as the unit is yet to be banned and the management has time to get back to
USFDA for resolutions. In terms of future pipeline, the companies’ Inhalation
segment is estimated to capture 8% of the overall potential sales being targeted
(market size of the future pipeline of products). We maintain our buy with a price
target of `1526.
IT Industry to grow at 8-9% in FY2018; Nasscom
Nasscom issued guidance and trends of the IT sector for FY2018. A) It said that
the IT sector is at an interesting inflection point. Most notably, the body said that
the IT sector will hire 1.3lakh to 1.5lakh people this year, as the industry is
focussing on re-skilling, new talent addition. B) In terms of revenue generation, the
body said the industry had added US$11bn revenue in the fiscal year 2017 with
8.6 % growth in CC (constant currency terms). NASSCOM and is expecting IT
industry’s services exports to grow 7-8% in the financial year 2017-18. It added
that the domestic IT services revenue is being expected at 10-11%. C) Digital a
bigger of new sunrise for IT industry. It has been a big driver for IT industry. The
guidance is broadly in line with the outlook given by the Industry players and
hence holds no big surprise. We maintain our buy on Infosys, Tech Mahindra &
HCL Tech.
Market Outlook
June 23, 2017
Economic and Political News
Govt. banks devise three-tier plan for NPA resolution
SEBI new ruling allows alternative investment funds (AIFs) to sell their shares in a
company any time after its initial public offering (IPO)
RBI adds three new members to oversight committee, empowers panel to
stressed asset cases where banks have over `500cr exposure
Opposition fields former speaker of the house Meira Kumar as presidential
candidate opposite Ram Nath Kovind
Corporate News
Wockhardt settles case with Teva and its affiliate in London High Court
Reliance Communications rallies over 6 percent after the company announced
that had started the process to monetise their real estate assets
Cental Govt. to take action on privatising Air India in 6 months
Market Outlook
June 23, 2017
Top Picks
Market Cap
CMP
Target
Upside
Company
Rationale
(` Cr)
(`)
(`)
(%)
Strong growth in domestic business due to its leadership
in acute therapeutic segment. Alkem expects to launch
Alkem Laboratories
22,341
1,869
2,161
15.7
more products in USA, which bodes for its international
business.
We expect the company would report strong profitability
Asian Granito
1,226
408
447
9.7
owing to better product mix, higher B2C sales and
amalgamation synergy.
Favourable outlook for the AC industry to augur well for
Cooling products business which is out pacing the market
Blue Star
6,036
631
760
20.4
growth. EMPPAC division's profitability to improve once
operating environment turns around.
With a focus on the low and medium income (LMI)
consumer segment, the company has increased its
Dewan Housing Finance
14,314
457
520
13.9
presence in tier-II & III cities where the growth opportunity
is immense.
Loan growth is likely to pick up after a sluggish FY17.
Karur Vysya Bank
8,711
144
160
11.0
Lower credit cost will help in strong bottomline growth.
Increasing share of CASA will help in NIM improvement.
Economic recovery to have favourable impact on
advertising & circulation revenue growth. Further, the
Jagran Prakashan
5,899
180
225
24.7
acquisition of a radio business (Radio City) would also
boost the company's revenue growth.
High order book execution in EPC segment, rising B2C
KEI Industries
1,791
230
258
12.1
sales and higher exports to boost the revenues and
profitability
Speedier execution and speedier sales, strong revenue
Mahindra Lifespace
2,225
434
522
20.4
visibilty in short-to-long run, attractive valuations
Massive capacity expansion along with rail advantage at
Navkar Corporation
3,085
216
265
22.5
ICD as well CFS augurs well for the company
Strong brands and distribution network would boost
Siyaram Silk Mills
1,966
2,097
2,500
19.2
growth going ahead. Stock currently trades at an
inexpensive valuation.
Market leadership in Hindi news genre and no.
2
viewership ranking in English news genre, exit from the
TV Today Network
1,515
254
344
35.4
radio business, and anticipated growth in ad spends by
corporates to benefit the stock.
Source: Company, Angel Research
Market Outlook
June 23, 2017
Key Upcoming Events
Global economic events release calendar
Bloomberg Data
Date
Time
Country
Event Description
Unit
Period
Last Reported
Estimated
Jun 23, 2017
1:00 PMGermany
PMI Manufacturing
Value
Jun P
59.50
59.00
1:00 PMGermany
PMI Services
Value
Jun P
55.40
55.40
7:30 PMUS
New home sales
Thousands
May
569.00
590.00
Jun 27, 2017
1:25 PMGermany
Unemployment change (000's)
Thousands
Jun
(9.00)
Jun 29, 2017
7:30 PMUS
Consumer Confidence
S.A./ 1985=100
Jun
117.90
115.40
Jun 30, 2017
6:00 PMUS
GDP Qoq (Annualised)
% Change
1Q T
1.20
1.20
6:30 AMChina
PMI Manufacturing
Value
Jun
51.20
51.00
2:00 PMUK
GDP (YoY)
% Change
1Q F
2.00
Jul 03, 2017
2:00 PMUK
PMI Manufacturing
Value
Jun
56.70
Jul 07, 2017
2:00 PMUK
Industrial Production (YoY)
% Change
May
(0.80)
6:00 PMUS
Change in Nonfarm payrolls
Thousands
Jun
138.00
6:00 PMUS
Unnemployment rate
%
Jun
4.30
Jul 10, 2017
India
Imports YoY%
% Change
Jun
33.10
India
Exports YoY%
% Change
Jun
8.30
7:00 AMChina
Consumer Price Index (YoY)
% Change
Jun
1.50
Jul 12, 2017
5:30 PMIndia
Industrial Production YoY
% Change
May
3.10
2:00 PMUK
Jobless claims change
% Change
Jun
7.30
Jul 13, 2017
US
Producer Price Index (mom)
% Change
Jun
(0.70)
China
Exports YoY%
% Change
Jun
8.70
Jul 14, 2017
6:45 PMUS
Industrial Production
%
Jun
-
6:00 PMUS
Consumer price index (mom)
% Change
Jun
(0.10)
12:00 PMIndia
Monthly Wholesale Prices YoY%
% Change
Jun
2.17
Source: Bloomberg, Angel Research
Market Outlook
June 23, 2017
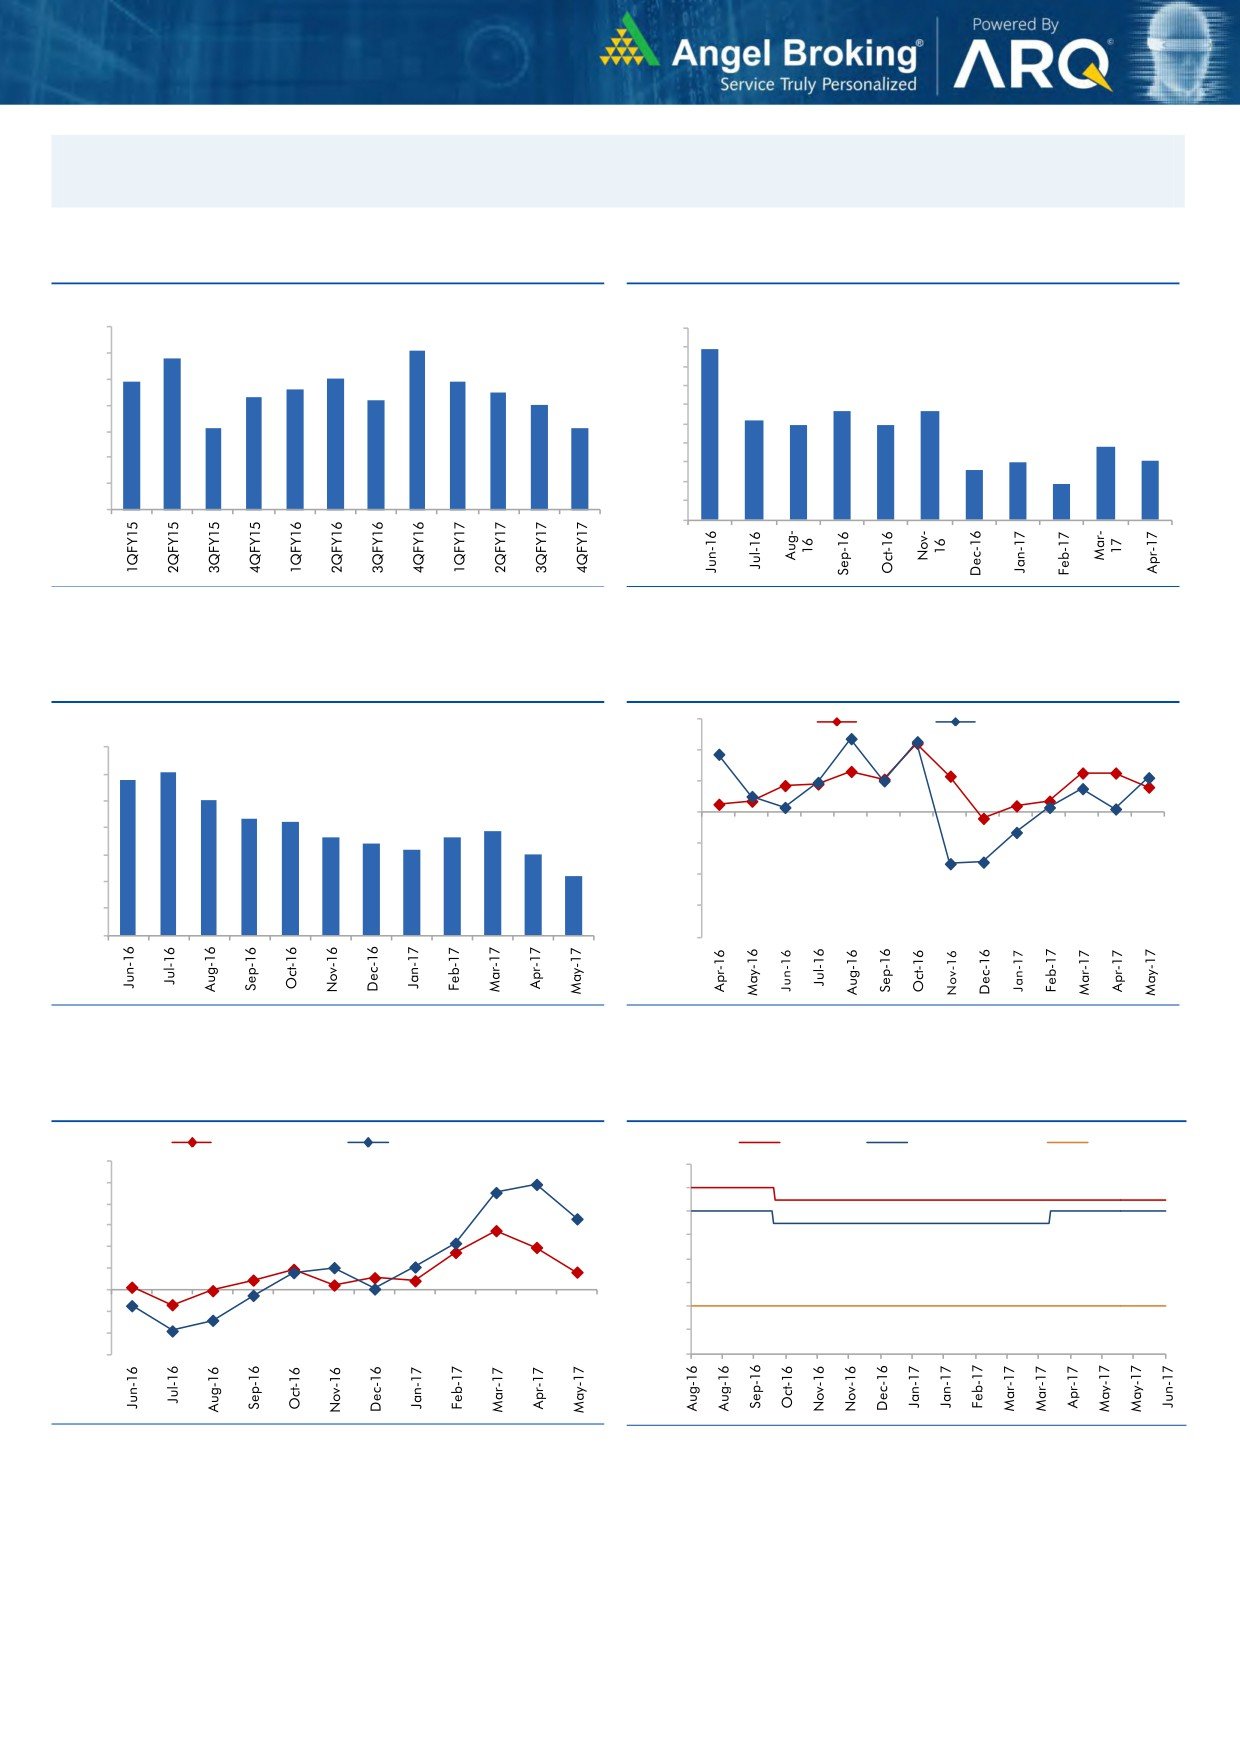
Macro watch
Exhibit 1: Quarterly GDP trends
Exhibit 2: IIP trends
(%)
(%)
10.0
10.0
9.1
8.9
8.8
9.0
9.0
7.9
8.0
7.9
8.0
7.6
7.5
8.0
7.3
7.2
7.0
7.0
5.7
5.7
7.0
6.0
5.2
6.1
6.1
4.9
4.9
6.0
5.0
3.8
4.0
3.0
3.1
2.6
5.0
3.0
1.9
4.0
2.0
1.0
3.0
-
Source: CSO, Angel Research
Source: MOSPI, Angel Research
Exhibit 3: Monthly CPI inflation trends
Exhibit 4: Manufacturing and services PMI
56.0
Mfg. PMI
Services PMI
(%)
7.0
54.0
6.1
5.8
6.0
5.1
52.0
5.0
4.3
4.2
3.9
50.0
3.6
3.7
4.0
3.4
3.2
3.0
48.0
3.0
2.2
46.0
2.0
1.0
44.0
-
42.0
Source: MOSPI, Angel Research
Source: Market, Angel Research; Note: Level above 50 indicates expansion
Exhibit 5: Exports and imports growth trends
Exhibit 6: Key policy rates
(%)
Exports yoy growth
Imports yoy growth
(%)
Repo rate
Reverse Repo rate
CRR
60.0
7.00
50.0
6.50
40.0
6.00
30.0
5.50
20.0
5.00
10.0
4.50
0.0
4.00
(10.0)
(20.0)
3.50
(30.0)
3.00
Source: Bloomberg, Angel Research
Source: RBI, Angel Research
Market Outlook
June 23, 2017
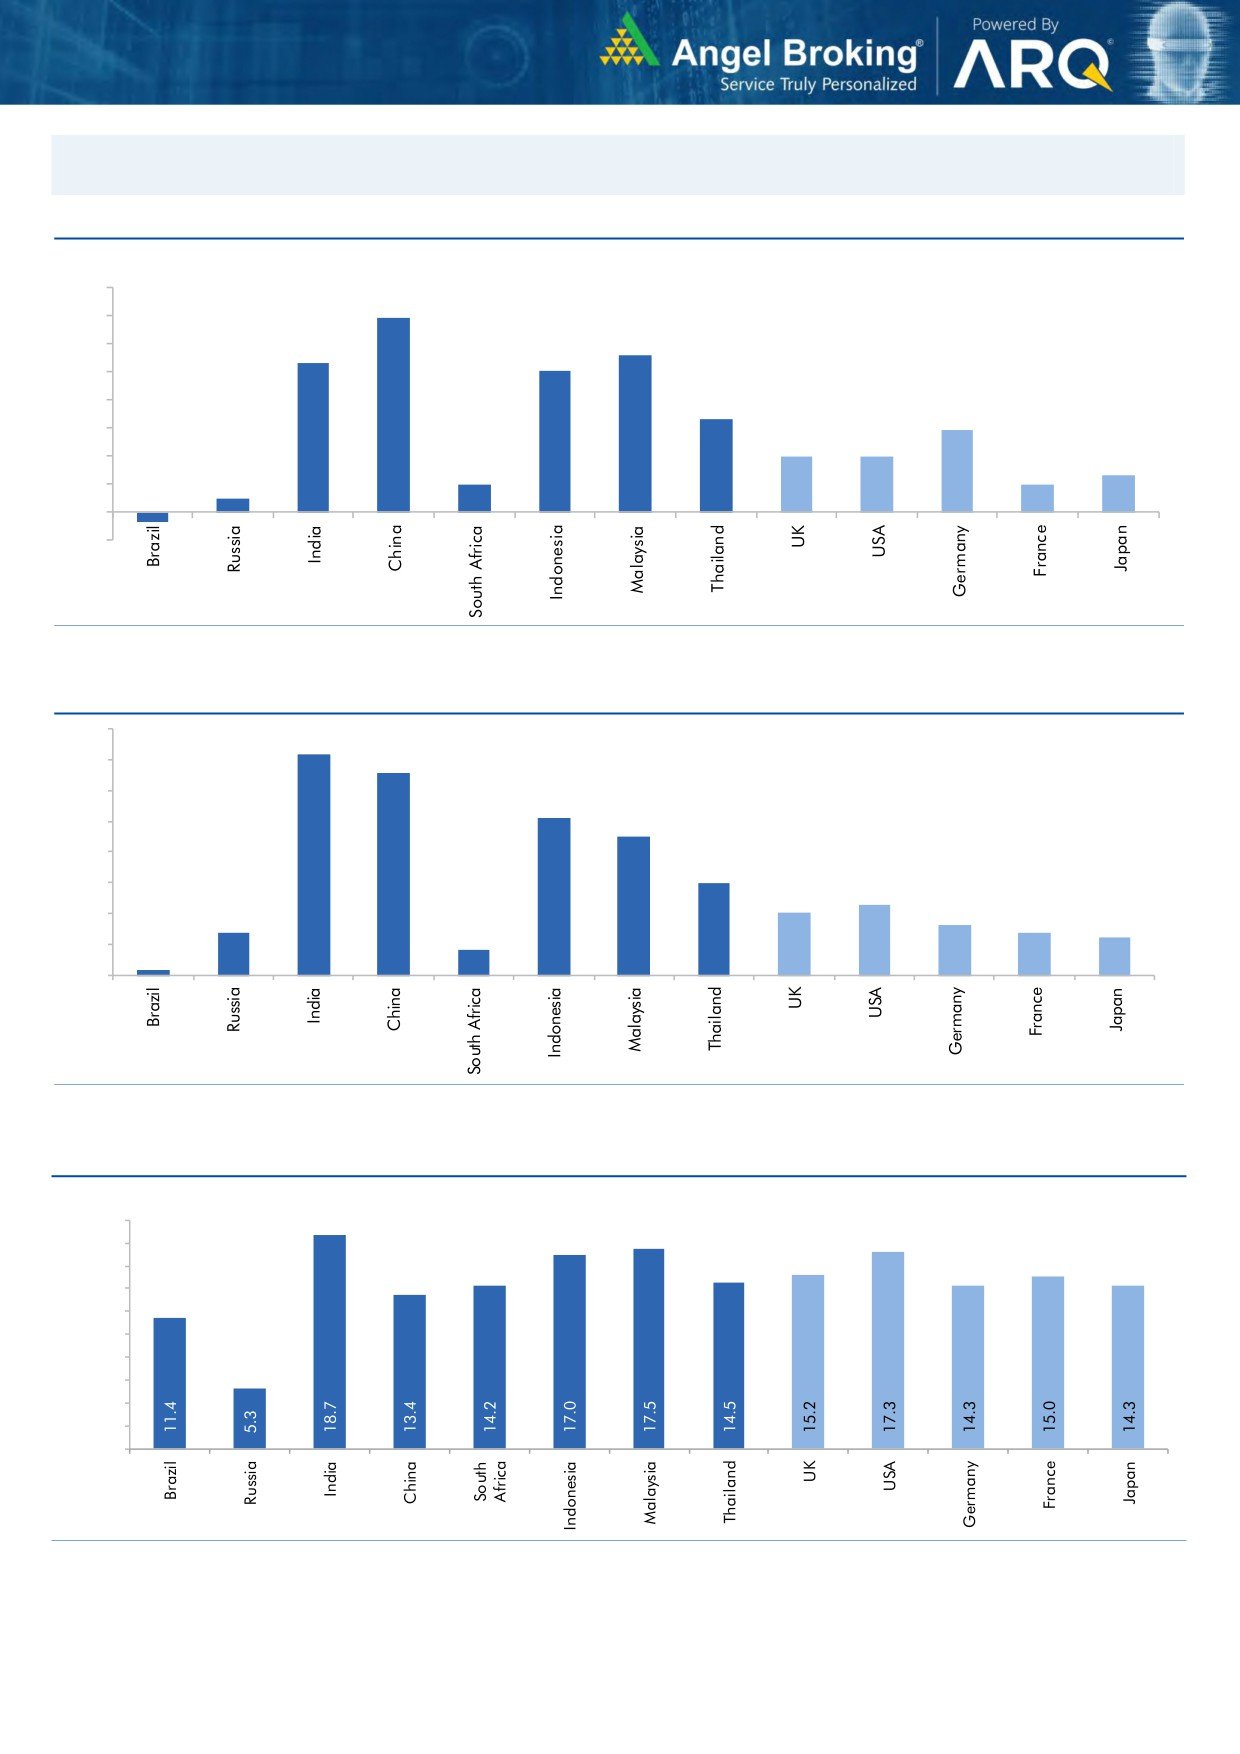
Global watch
Exhibit 1: Latest quarterly GDP Growth (%, yoy) across select developing and developed countries
(%)
8.0
6.9
7.0
5.6
6.0
5.3
5.0
1.0
5.0
4.0
3.3
2.9
3.0
2.0
2.0
0.5
2.0
1.0
1.3
1.0
-
(1.0)
(0.4)
Source: Bloomberg, Angel Research
Exhibit 2: 2016 GDP Growth projection by IMF (%, yoy) across select developing and developed countries
(%)
7.2
7.0
6.6
6.0
5.1
5.0
4.5
4.0
3.0
3.0
2.3
2.0
1.4
1.6
2.0
1.4
1.2
0.2
0.8
1.0
-
Source: IMF, Angel Research
Exhibit 3: One year forward P-E ratio across select developing and developed countries
(x)
20.0
18.0
16.0
14.0
12.0
10.0
8.0
6.0
4.0
2.0
-
Source: IMF, Angel Research
Market Outlook
June 23, 2017
Exhibit 4: Relative performance of indices across globe
Returns (%)
Country
Name of index
Closing price
1M
3M
1YR
Brazil
Bovespa
61,272
(0.7)
(5.6)
21.7
Russia
Micex
1,860
(4.6)
(8.9)
(1.3)
India
Nifty
9,630
2.6
5.6
17.9
China
Shanghai Composite
3,147
2.2
(3.4)
10.9
South Africa
Top 40
44,945
(6.4)
(1.3)
(4.4)
Mexico
Mexbol
49,017
(0.1)
0.9
6.2
Indonesia
LQ45
978
0.7
8.6
17.1
Malaysia
KLCI
1,777
0.1
1.3
9.3
Thailand
SET 50
995
0.4
0.7
9.2
USA
Dow Jones
21,397
2.4
3.6
18.8
UK
FTSE
7,439
(0.8)
0.1
21.2
Japan
Nikkei
20,111
2.5
3.4
26.3
Germany
DAX
12,794
1.4
6.1
35.4
France
CAC
5,282
(1.2)
5.6
24.6
Source: Bloomberg, Angel Research
Stock Watch
June 23, 2017
Company Name
Reco
CMP
Target
Mkt Cap
Sales ( Čcr )
OPM(%)
EPS (Č)
PER(x)
P/BV(x)
RoE(%)
EV/Sales(x)
(Č)
Price ( Č)
( Č cr )
FY17E FY18E
FY17E
FY18E
FY17E
FY18E
FY17E
FY18E
FY17E
FY18E
FY17E
FY18E
FY17E
FY18E
Agri / Agri Chemical
Rallis
Reduce
242
209
4,704
1,937
2,164
13.3
14.3
9.0
11.0
26.9
22.0
4.7
4.1
18.4
19.8
2.5
2.2
United Phosphorus
Neutral
860
-
43,678
15,176
17,604
18.5
18.5
37.4
44.6
23.0
19.3
4.5
3.7
21.4
21.2
3.0
2.5
Auto & Auto Ancillary
Ashok Leyland
Buy
93
111
27,275
20,021
21,915
11.6
11.9
4.5
5.3
20.7
17.5
4.2
3.8
20.6
21.5
1.3
1.2
Bajaj Auto
Neutral
2,840
-
82,193
25,093
27,891
19.5
19.2
143.9
162.5
19.7
17.5
5.5
4.8
30.3
29.4
3.0
2.6
Bharat Forge
Neutral
1,154
-
26,871
7,726
8,713
20.5
21.2
35.3
42.7
32.7
27.0
6.0
5.5
18.9
20.1
3.5
3.1
Eicher Motors
Neutral
27,681
-
75,353
16,583
20,447
17.5
18.0
598.0
745.2
46.3
37.2
15.8
12.0
41.2
38.3
4.4
3.5
Gabriel India
Neutral
159
-
2,285
1,544
1,715
9.0
9.3
5.4
6.3
29.5
25.3
5.6
4.9
18.9
19.5
1.4
1.3
Hero Motocorp
Neutral
3,733
-
74,550
28,083
30,096
15.3
15.7
171.8
187.0
21.7
20.0
7.6
6.4
30.1
27.9
2.5
2.3
Jamna Auto Industries Neutral
264
-
2,102
1,486
1,620
9.8
9.9
15.0
17.2
17.6
15.3
3.8
3.3
21.8
21.3
1.5
1.3
L G Balakrishnan & Bros Neutral
802
-
1,258
1,302
1,432
11.6
11.9
43.7
53.0
18.4
15.1
2.6
2.4
13.8
14.2
1.1
1.0
Mahindra and Mahindra Neutral
1,396
-
86,711
46,534
53,077
11.6
11.7
67.3
78.1
20.7
17.9
3.4
2.9
15.4
15.8
1.8
1.6
Maruti
Neutral
7,315
-
220,979
67,822
83,288
16.0
16.4
253.8
312.4
28.8
23.4
6.6
5.4
23.0
22.9
2.9
2.3
Minda Industries
Neutral
599
-
5,173
2,728
3,042
9.0
9.1
68.2
86.2
8.8
6.9
2.0
1.6
23.8
24.3
2.0
1.7
Motherson Sumi
Neutral
471
-
66,156
45,896
53,687
7.8
8.3
13.0
16.1
36.1
29.3
11.7
9.3
34.7
35.4
1.5
1.3
Rane Brake Lining
Neutral
1,352
-
1,070
511
562
11.3
11.5
28.1
30.9
48.1
43.7
7.3
6.7
15.3
15.0
2.2
2.0
Setco Automotive
Neutral
38
-
514
741
837
13.0
13.0
15.2
17.0
2.5
2.3
0.4
0.4
15.8
16.3
1.1
1.0
Tata Motors
Neutral
453
-
130,739
300,209
338,549
8.9
8.4
42.7
54.3
10.6
8.4
1.7
1.4
15.6
17.2
0.6
0.5
TVS Motor
Neutral
542
-
25,754
13,390
15,948
6.9
7.1
12.8
16.5
42.5
32.8
10.6
8.4
26.3
27.2
2.0
1.6
Amara Raja Batteries
Buy
848
1,009
14,478
5,305
6,100
16.0
16.3
28.4
34.0
29.9
24.9
5.8
4.8
19.3
19.3
2.7
2.4
Exide Industries
Neutral
219
-
18,590
7,439
8,307
15.0
15.0
8.1
9.3
27.0
23.5
3.8
3.4
14.3
16.7
2.1
1.9
Apollo Tyres
Neutral
257
-
13,102
12,877
14,504
14.3
13.9
21.4
23.0
12.0
11.2
1.9
1.6
16.4
15.2
1.2
1.1
Ceat
Neutral
1,837
-
7,430
7,524
8,624
13.0
12.7
131.1
144.3
14.0
12.7
2.6
2.2
19.8
18.6
1.1
0.9
JK Tyres
Neutral
170
-
3,852
7,455
8,056
15.0
15.0
21.8
24.5
7.8
6.9
1.6
1.3
22.8
21.3
0.6
0.6
Swaraj Engines
Neutral
2,334
-
2,899
660
810
15.2
16.4
54.5
72.8
42.8
32.1
13.4
12.1
31.5
39.2
4.2
3.4
Subros
Neutral
255
-
1,529
1,488
1,681
11.7
11.9
6.4
7.2
39.8
35.6
4.2
3.8
10.8
11.4
1.3
1.1
Indag Rubber
Neutral
215
-
563
286
326
19.8
16.8
11.7
13.3
18.4
16.1
3.1
2.9
17.8
17.1
1.6
1.4
Capital Goods
ACE
Neutral
72
-
707
709
814
4.1
4.6
1.4
2.1
51.1
34.1
2.1
2.0
4.4
6.0
1.2
1.0
BEML
Neutral
1,544
-
6,432
3,451
4,055
6.3
9.2
31.4
57.9
49.2
26.7
3.0
2.7
6.3
10.9
2.0
1.7
Bharat Electronics
Neutral
166
-
37,168
8,137
9,169
16.8
17.2
58.7
62.5
2.8
2.7
0.4
0.4
44.6
46.3
3.5
3.2
Stock Watch
June 23, 2017
Company Name
Reco
CMP
Target
Mkt Cap
Sales ( Čcr )
OPM(%)
EPS (Č)
PER(x)
P/BV(x)
RoE(%)
EV/Sales(x)
(Č)
Price ( Č)
( Č cr )
FY17E
FY18E
FY17E
FY18E
FY17E
FY18E
FY17E
FY18E
FY17E
FY18E
FY17E
FY18E
FY17E
FY18E
Capital Goods
Voltas
Neutral
465
-
15,391
6,511
7,514
7.9
8.7
12.9
16.3
36.1
28.5
6.5
5.7
16.7
18.5
2.1
1.8
BGR Energy
Neutral
153
-
1,102
16,567
33,848
6.0
5.6
7.8
5.9
19.6
25.9
1.1
1.1
4.7
4.2
0.2
0.1
BHEL
Neutral
137
-
33,495
28,797
34,742
-
2.8
2.3
6.9
59.5
19.8
1.0
1.0
1.3
4.8
0.8
0.6
Blue Star
Buy
631
760
6,036
4,283
5,077
5.9
7.3
14.9
22.1
42.4
28.5
8.2
6.9
20.4
26.4
1.5
1.2
CG Power and Industrial
Neutral
84
-
5,283
5,777
6,120
5.9
7.0
3.3
4.5
25.6
18.7
1.1
1.1
4.4
5.9
0.9
0.7
Solutions
Greaves Cotton
Neutral
163
-
3,974
1,755
1,881
16.8
16.9
7.8
8.5
20.9
19.2
4.2
3.9
20.6
20.9
2.0
1.8
Inox Wind
Neutral
141
-
3,135
5,605
6,267
15.7
16.4
24.8
30.0
5.7
4.7
1.6
1.2
25.9
24.4
0.6
0.5
KEC International
Neutral
243
-
6,240
9,294
10,186
7.9
8.1
9.9
11.9
24.5
20.4
3.6
3.1
15.6
16.3
0.9
0.8
KEI Industries
Accumulate
230
258
1,791
2,633
3,001
10.4
10.0
12.7
13.0
18.1
17.7
3.9
3.2
21.4
18.2
0.9
0.8
Thermax
Neutral
936
-
11,151
5,421
5,940
7.3
7.3
25.7
30.2
36.4
31.0
4.4
4.0
12.2
13.1
1.9
1.8
VATech Wabag
Neutral
717
-
3,914
3,136
3,845
8.9
9.1
26.0
35.9
27.6
20.0
3.5
2.9
13.4
15.9
1.2
0.9
Cement
ACC
Neutral
1,652
-
31,022
11,225
13,172
13.2
16.9
44.5
75.5
37.1
21.9
3.5
3.2
11.2
14.2
2.8
2.4
Ambuja Cements
Neutral
244
-
48,529
9,350
10,979
18.2
22.5
5.8
9.5
42.1
25.7
3.5
3.2
10.2
12.5
5.2
4.4
India Cements
Neutral
211
-
6,485
4,364
4,997
18.5
19.2
7.9
11.3
26.7
18.7
1.9
1.9
8.0
8.5
2.2
2.0
JK Cement
Neutral
983
-
6,874
4,398
5,173
15.5
17.5
31.2
55.5
31.5
17.7
3.8
3.3
12.0
15.5
2.1
1.8
J K Lakshmi Cement
Neutral
490
-
5,771
2,913
3,412
14.5
19.5
7.5
22.5
65.4
21.8
4.0
3.4
12.5
18.0
2.6
2.2
Orient Cement
Neutral
149
-
3,049
2,114
2,558
18.5
20.5
8.1
11.3
18.4
13.2
2.7
2.3
9.0
14.0
2.1
1.6
UltraTech Cement
Neutral
4,059
-
111,423
25,768
30,385
21.0
23.5
111.0
160.0
36.6
25.4
4.7
4.1
13.5
15.8
4.4
3.7
Construction
ITNL
Neutral
100
-
3,304
8,946
10,017
31.0
31.6
8.1
9.1
12.4
11.0
0.5
0.5
4.2
5.0
3.7
3.4
KNR Constructions
Neutral
205
-
2,881
1,385
1,673
14.7
14.0
41.2
48.5
5.0
4.2
0.9
0.8
14.9
15.2
2.2
1.8
Larsen & Toubro
Neutral
1,736
-
162,083
111,017
124,908
11.0
11.0
61.1
66.7
28.4
26.0
3.4
3.2
13.1
12.9
2.5
2.3
Gujarat Pipavav Port
Neutral
149
-
7,220
705
788
52.2
51.7
5.0
5.6
29.9
26.7
3.0
2.6
11.2
11.2
9.9
8.4
Nagarjuna Const.
Neutral
92
-
5,090
8,842
9,775
9.1
8.8
5.3
6.4
17.3
14.3
1.4
1.3
8.2
9.1
0.7
0.6
PNC Infratech
Neutral
146
-
3,744
2,350
2,904
13.1
13.2
9.0
8.8
16.2
16.6
0.6
0.5
15.9
13.9
1.7
1.4
Simplex Infra
Neutral
515
-
2,546
6,829
7,954
10.5
10.5
31.4
37.4
16.4
13.8
1.7
1.6
9.9
13.4
0.8
0.7
Power Mech Projects
Neutral
585
-
861
1,801
2,219
12.7
14.6
72.1
113.9
8.1
5.1
1.5
1.3
16.8
11.9
0.5
0.4
Sadbhav Engineering
Neutral
305
-
5,227
3,598
4,140
10.3
10.6
9.0
11.9
33.9
25.6
3.5
3.1
9.9
11.9
1.7
1.5
NBCC
Neutral
207
-
18,621
7,428
9,549
7.9
8.6
8.2
11.0
25.2
18.8
1.3
1.0
28.2
28.7
2.2
1.7
MEP Infra
Neutral
105
-
1,701
1,877
1,943
30.6
29.8
3.0
4.2
34.9
24.9
16.9
11.4
0.6
0.6
2.3
2.1
Stock Watch
June 23, 2017
Company Name
Reco
CMP
Target
Mkt Cap
Sales ( Čcr )
OPM(%)
EPS (Č)
PER(x)
P/BV(x)
RoE(%)
EV/Sales(x)
(Č)
Price ( Č)
( Č cr )
FY17E
FY18E
FY17E
FY18E
FY17E
FY18E
FY17E
FY18E
FY17E
FY18E
FY17E
FY18E
FY17E
FY18E
Construction
SIPL
Neutral
112
-
3,936
1,036
1,252
65.5
66.2
(8.4)
(5.6)
4.2
4.8
(22.8)
(15.9)
12.0
10.0
Engineers India
Neutral
155
-
10,448
1,725
1,935
16.0
19.1
11.4
13.9
13.6
11.2
1.9
1.8
13.4
15.3
5.0
4.5
Financials
Axis Bank
Accumulate
508
580
121,737
46,932
53,575
3.5
3.4
32.4
44.6
15.7
11.4
2.0
1.8
13.6
16.5
-
-
Bank of Baroda
Neutral
165
-
38,019
19,980
23,178
1.8
1.8
11.5
17.3
14.4
9.5
1.6
1.4
8.3
10.1
-
-
Canara Bank
Neutral
351
-
20,947
15,225
16,836
1.8
1.8
14.5
28.0
24.2
12.5
1.7
1.4
5.8
8.5
-
-
Can Fin Homes
Neutral
3,255
-
8,664
420
526
3.5
3.5
86.5
107.8
37.6
30.2
8.1
6.6
23.6
24.1
-
-
Cholamandalam Inv. &
Accumulate
1,084
1,230
16,941
2,012
2,317
6.3
6.3
42.7
53.6
25.4
20.2
4.0
3.4
16.9
18.3
-
-
Fin. Co.
Dewan Housing Finance Accumulate
457
520
14,314
2,225
2,688
2.9
2.9
29.7
34.6
15.4
13.2
2.5
1.6
16.1
14.8
-
-
Equitas Holdings
Buy
154
235
5,212
939
1,281
11.7
11.5
5.8
8.2
26.6
18.8
2.3
2.0
10.9
11.5
-
-
Federal Bank
Accumulate
118
125
20,278
8,259
8,995
3.0
3.0
4.3
5.6
27.3
21.0
2.3
2.1
8.5
10.1
-
-
HDFC
Neutral
1,655
-
263,142
11,475
13,450
3.4
3.4
45.3
52.5
36.5
31.5
7.0
6.2
20.2
20.5
-
-
HDFC Bank
Neutral
1,698
-
436,147
46,097
55,433
4.5
4.5
58.4
68.0
29.1
25.0
5.1
4.3
18.8
18.6
-
-
ICICI Bank
Accumulate
289
315
185,619
42,800
44,686
3.1
3.3
18.0
21.9
16.1
13.2
2.2
2.0
11.1
12.3
-
-
Karur Vysya Bank
Accumulate
144
160
8,711
5,640
6,030
3.3
3.2
8.9
10.0
16.2
14.4
1.7
1.6
11.2
11.4
-
-
Lakshmi Vilas Bank
Neutral
200
-
3,841
3,339
3,799
2.7
2.8
11.0
14.0
18.2
14.3
1.9
1.7
11.2
12.7
-
-
LIC Housing Finance
Neutral
770
-
38,844
3,712
4,293
2.6
2.5
39.0
46.0
19.7
16.7
3.7
3.2
19.9
20.1
-
-
Punjab Natl.Bank
Neutral
146
-
30,973
23,532
23,595
2.3
2.4
6.8
12.6
21.4
11.6
3.3
2.4
3.3
6.5
-
-
RBL Bank
Neutral
512
-
19,263
1,783
2,309
2.6
2.6
12.7
16.4
40.3
31.2
4.4
3.9
12.8
13.3
-
-
Repco Home Finance
Neutral
870
-
5,443
388
457
4.5
4.2
30.0
38.0
29.0
22.9
4.8
4.1
18.0
19.2
-
-
South Ind.Bank
Neutral
29
-
5,212
6,435
7,578
2.5
2.5
2.7
3.1
10.7
9.3
1.4
1.2
10.1
11.2
-
-
St Bk of India
Neutral
295
-
254,257
88,650
98,335
2.6
2.6
13.5
18.8
21.8
15.7
2.1
1.8
7.0
8.5
-
-
Union Bank
Neutral
151
-
10,360
13,450
14,925
2.3
2.3
25.5
34.5
5.9
4.4
0.9
0.7
7.5
10.2
-
-
Yes Bank
Neutral
1,453
-
66,449
8,978
11,281
3.3
3.4
74.0
90.0
19.6
16.1
3.7
3.2
17.0
17.2
-
-
FMCG
Akzo Nobel India
Neutral
1,825
-
8,754
2,955
3,309
13.3
13.7
57.2
69.3
31.9
26.3
10.4
8.8
32.7
33.3
2.8
2.4
Asian Paints
Neutral
1,164
-
111,622
17,128
18,978
16.8
16.4
19.1
20.7
60.9
56.2
21.2
20.0
34.8
35.5
6.4
5.8
Britannia
Neutral
3,640
-
43,691
9,594
11,011
14.6
14.9
80.3
94.0
45.3
38.7
18.6
14.4
41.2
-
4.4
3.8
Colgate
Neutral
1,101
-
29,940
4,605
5,149
23.4
23.4
23.8
26.9
46.3
40.9
25.6
20.0
64.8
66.8
6.4
5.7
Dabur India
Neutral
290
-
51,066
8,315
9,405
19.8
20.7
8.1
9.2
35.8
31.5
10.0
8.3
31.6
31.0
5.8
5.1
GlaxoSmith Con*
Neutral
5,370
-
22,582
4,350
4,823
21.2
21.4
179.2
196.5
30.0
27.3
8.0
6.7
27.1
26.8
4.6
4.0
Stock Watch
June 23, 2017
Company Name
Reco
CMP
Target
Mkt Cap
Sales ( Čcr )
OPM(%)
EPS (Č)
PER(x)
P/BV(x)
RoE(%)
EV/Sales(x)
(Č)
Price ( Č)
( Č cr )
FY17E FY18E
FY17E
FY18E
FY17E
FY18E
FY17E
FY18E
FY17E
FY18E
FY17E
FY18E
FY17E
FY18E
FMCG
Godrej Consumer
Neutral
960
-
65,392
10,235
11,428
18.4
18.6
41.1
44.2
23.4
21.7
5.2
4.4
24.9
24.8
6.5
5.7
HUL
Neutral
1,094
-
236,846
35,252
38,495
17.8
17.8
20.7
22.4
53.0
48.9
50.7
43.4
95.6
88.9
6.6
6.0
ITC
Neutral
311
-
377,419
40,059
44,439
38.3
39.2
9.0
10.1
34.6
30.7
9.7
8.4
27.8
27.5
8.9
8.0
Marico
Neutral
314
-
40,469
6,430
7,349
18.8
19.5
6.4
7.7
49.0
40.7
14.8
12.4
33.2
32.5
6.1
5.3
Nestle*
Neutral
6,773
-
65,301
10,073
11,807
20.7
21.5
124.8
154.2
54.3
43.9
22.3
20.0
34.8
36.7
6.3
5.3
Tata Global
Neutral
155
-
9,767
8,675
9,088
9.8
9.8
7.4
8.2
20.9
18.9
1.7
1.6
7.9
8.1
1.0
1.0
Procter & Gamble
Neutral
8,001
-
25,970
2,939
3,342
23.2
23.0
146.2
163.7
54.7
48.9
13.9
11.5
25.3
23.5
8.4
7.3
Hygiene
IT
HCL Tech^
Buy
849
1,014
121,108
46,723
52,342
22.1
20.9
60.0
62.8
14.2
13.5
3.6
3.0
25.3
22.4
2.3
2.0
Infosys
Buy
940
1,179
215,982
68,484
73,963
26.0
26.0
63.0
64.0
14.9
14.7
3.1
2.9
20.8
19.7
2.8
2.5
TCS
Accumulate
2,396
2,651
472,065
117,966
127,403
27.5
27.6
134.3
144.5
17.8
16.6
5.3
4.9
29.8
29.7
3.7
3.4
Tech Mahindra
Buy
387
533
37,731
29,141
31,051
14.4
15.0
32.3
35.6
12.0
10.9
2.1
1.9
17.1
17.0
1.1
1.0
Wipro
Accumulate
255
280
123,916
55,421
58,536
20.3
20.3
35.1
36.5
7.3
7.0
1.3
1.1
19.2
14.6
1.7
1.4
Media
D B Corp
Neutral
376
-
6,918
2,297
2,590
27.4
28.2
21.0
23.4
17.9
16.1
4.2
3.6
23.7
23.1
2.8
2.4
HT Media
Neutral
82
-
1,913
2,693
2,991
12.6
12.9
7.9
9.0
10.4
9.1
0.9
0.8
7.8
8.3
0.3
0.2
Jagran Prakashan
Buy
180
225
5,899
2,283
2,555
28.0
28.0
10.6
12.3
17.0
14.7
3.6
3.2
21.4
21.4
2.6
2.3
Sun TV Network
Neutral
833
-
32,821
2,850
3,265
70.1
71.0
26.2
30.4
31.8
27.4
8.1
7.2
24.3
25.6
11.1
9.6
Hindustan Media
Neutral
271
-
1,988
1,016
1,138
24.3
25.2
27.3
30.1
9.9
9.0
1.9
1.7
16.2
15.8
1.3
1.1
Ventures
TV Today Network
Buy
253
344
1,510
608
667
21.5
22.3
15.7
19.2
16.1
13.2
2.5
2.1
16.1
16.0
2.1
1.8
Metals & Mining
Coal India
Neutral
246
-
152,826
84,638
94,297
21.4
22.3
24.5
27.1
10.1
9.1
4.2
4.0
42.6
46.0
1.3
1.2
Hind. Zinc
Neutral
253
-
106,710
14,252
18,465
55.9
48.3
15.8
21.5
16.0
11.8
2.6
2.3
17.0
20.7
7.5
5.8
Hindalco
Neutral
192
-
42,972
107,899
112,095
7.4
8.2
9.2
13.0
20.8
14.7
1.0
1.0
4.8
6.6
0.9
0.9
JSW Steel
Neutral
197
-
47,728
53,201
58,779
16.1
16.2
130.6
153.7
1.5
1.3
0.2
0.2
14.0
14.4
1.7
1.4
NMDC
Neutral
109
-
34,581
6,643
7,284
44.4
47.7
7.1
7.7
15.4
14.2
1.3
1.3
8.8
9.2
3.0
2.7
SAIL
Neutral
58
-
24,140
47,528
53,738
(0.7)
2.1
(1.9)
2.6
22.5
0.6
0.6
(1.6)
3.9
1.4
1.2
Vedanta
Neutral
234
-
87,075
71,744
81,944
19.2
21.7
13.4
20.1
17.5
11.7
1.5
1.3
8.4
11.3
1.6
1.3
Tata Steel
Neutral
515
-
49,974
121,374
121,856
7.2
8.4
18.6
34.3
27.7
15.0
1.7
1.6
6.1
10.1
1.1
1.0
Oil & Gas
GAIL
Neutral
360
-
60,845
56,220
65,198
9.3
10.1
27.1
33.3
13.3
10.8
1.2
1.1
9.3
10.7
1.3
1.1
ONGC
Neutral
161
-
205,974
137,222
152,563
15.0
21.8
19.5
24.1
8.2
6.7
0.7
0.7
8.5
10.1
1.8
1.6
Indian Oil Corp
Neutral
394
-
191,080
373,359
428,656
5.9
5.5
54.0
59.3
7.3
6.6
1.1
1.0
16.0
15.6
0.7
0.6
Stock Watch
June 23, 2017
Company Name
Reco
CMP
Target
Mkt Cap
Sales ( Čcr )
OPM(%)
EPS (Č)
PER(x)
P/BV(x)
RoE(%)
EV/Sales(x)
(Č)
Price ( Č)
( Č cr )
FY17E FY18E
FY17E
FY18E
FY17E
FY18E
FY17E
FY18E
FY17E
FY18E
FY17E
FY18E
FY17E
FY18E
Oil & Gas
Reliance Industries
Neutral
1,433
-
465,979
301,963
358,039
12.1
12.6
87.7
101.7
16.3
14.1
1.7
1.5
10.7
11.3
2.0
1.7
Pharmaceuticals
Alembic Pharma
Buy
521
648
9,824
3,101
3,966
19.7
20.5
21.4
25.5
24.4
20.4
5.2
4.2
23.0
22.8
3.1
2.3
Alkem Laboratories Ltd
Buy
1,869
2,161
22,341
5,853
6,901
17.1
18.4
74.6
85.0
25.0
22.0
5.3
4.4
21.1
20.2
3.8
3.2
Aurobindo Pharma
Buy
666
823
39,002
14,845
17,086
21.5
22.1
39.4
44.7
16.9
14.9
4.2
3.3
27.6
24.7
2.8
2.4
Aventis*
Neutral
4,274
-
9,844
2,206
2,508
16.6
16.8
128.9
139.9
33.2
30.6
5.7
4.4
21.6
23.5
4.2
3.5
Cadila Healthcare
Reduce
526
450
53,854
9,220
11,584
18.4
20.3
14.5
18.7
36.3
28.1
7.7
6.3
23.5
24.6
6.2
4.7
Cipla
Reduce
539
461
43,358
14,281
16,619
15.4
16.2
12.5
19.7
43.1
27.4
3.5
3.1
8.4
12.0
3.2
2.7
Dr Reddy's
Neutral
2,629
-
43,576
14,081
15,937
16.1
18.6
72.6
105.9
36.2
24.8
3.6
3.2
9.6
13.6
3.3
2.9
Dishman Pharma
Sell
143
1,718
1,890
22.7
22.8
9.5
11.3
10.1
10.9
3.3
2.9
GSK Pharma*
Neutral
2,465
-
20,878
2,927
3,290
11.8
16.2
34.4
49.6
71.7
49.7
10.4
10.8
13.9
21.3
6.9
6.2
Indoco Remedies
Sell
185
153
1,705
1,067
1,154
12.1
14.9
8.4
11.3
22.0
16.4
2.6
2.3
12.6
15.0
1.8
1.7
Ipca labs
Buy
467
620
5,897
3,211
3,593
13.9
14.5
15.4
19.4
30.4
24.1
2.4
2.2
8.2
9.5
2.0
1.7
Lupin
Buy
1,067
1,526
48,194
17,120
18,657
24.1
24.1
56.9
61.1
18.8
17.5
3.6
3.0
20.7
18.6
3.1
2.5
Natco Pharma
Accumulate
970
1,060
16,912
2,065
1,988
33.1
33.7
27.9
25.7
34.8
37.7
10.1
8.6
29.2
22.9
8.3
8.4
Sun Pharma
Buy
539
712
129,247
30,264
32,899
29.0
26.9
32.7
31.6
16.5
17.1
3.5
3.0
22.2
18.7
4.0
3.6
Power
Tata Power
Neutral
83
-
22,382
36,916
39,557
17.4
27.1
5.1
6.3
16.2
13.1
1.4
1.3
9.0
10.3
1.6
1.5
NTPC
Neutral
159
-
131,020
86,605
95,545
17.5
20.8
11.8
13.4
13.5
11.9
1.4
1.3
10.5
11.1
2.9
2.9
Power Grid
Accumulate
202
223
105,469
25,315
29,193
88.2
88.7
14.2
17.2
14.2
11.8
2.2
1.9
15.2
16.1
8.8
7.9
Real Estate
Prestige Estate
Neutral
258
-
9,662
4,707
5,105
25.2
26.0
10.3
13.0
25.0
19.8
2.0
1.9
10.3
10.2
3.2
2.9
MLIFE
Buy
434
522
2,225
1,152
1,300
22.7
24.6
29.9
35.8
14.5
12.1
1.1
1.0
7.6
8.6
2.6
2.2
Telecom
Bharti Airtel
Neutral
365
-
146,085
105,086
114,808
34.5
34.7
12.2
16.4
30.0
22.3
2.0
1.9
6.8
8.4
2.3
2.0
Idea Cellular
Neutral
80
-
28,938
40,133
43,731
37.2
37.1
6.4
6.5
12.5
12.4
1.0
1.0
8.2
7.6
1.7
1.5
zOthers
Abbott India
Neutral
4,342
-
9,227
3,153
3,583
14.1
14.4
152.2
182.7
28.5
23.8
140.1
119.6
25.6
26.1
2.6
2.3
Asian Granito
Accumulate
408
447
1,226
1,066
1,169
11.6
12.5
13.0
16.0
31.4
25.5
3.1
2.7
9.5
10.7
1.5
1.3
Bajaj Electricals
Buy
340
395
3,439
4,801
5,351
5.7
6.2
10.4
13.7
32.6
24.8
4.0
3.6
12.4
14.5
0.7
0.6
Banco Products (India)
Neutral
225
-
1,611
1,353
1,471
12.3
12.4
14.5
16.3
15.5
13.8
21.5
19.3
14.5
14.6
1.1
121.6
Coffee Day Enterprises
Neutral
249
-
5,122
2,964
3,260
20.5
21.2
4.7
8.0
-
31.1
2.9
2.6
5.5
8.5
2.1
1.9
Ltd
Competent Automobiles Neutral
201
-
129
1,137
1,256
3.1
2.7
28.0
23.6
7.2
8.5
38.6
34.9
14.3
11.5
0.1
0.1
Elecon Engineering
Neutral
60
-
669
1,482
1,660
13.7
14.5
3.9
5.8
15.3
10.3
3.6
3.3
7.8
10.9
0.8
0.7
Stock Watch
June 23, 2017
Company Name
Reco
CMP
Target
Mkt Cap
Sales ( Čcr )
OPM(%)
EPS (Č)
PER(x)
P/BV(x)
RoE(%)
EV/Sales(x)
(Č)
Price ( Č)
( Č cr )
FY17E
FY18E
FY17E
FY18E
FY17E
FY18E
FY17E
FY18E
FY17E
FY18E
FY17E
FY18E
FY17E
FY18E
zOthers
Finolex Cables
Neutral
483
-
7,390
2,883
3,115
12.0
12.1
14.2
18.6
34.0
26.0
18.1
15.8
15.8
14.6
2.3
2.0
Garware Wall Ropes
Neutral
822
-
1,799
863
928
15.1
15.2
36.4
39.4
22.6
20.9
4.1
3.5
17.5
15.9
2.0
1.8
Goodyear India*
Neutral
876
-
2,022
1,598
1,704
10.4
10.2
49.4
52.6
17.7
16.7
81.9
71.9
18.2
17.0
1.0
135.4
Hitachi
Neutral
2,009
-
5,463
2,081
2,433
8.8
8.9
33.4
39.9
60.2
50.4
48.5
40.4
22.1
21.4
2.6
2.2
HSIL
Neutral
387
-
2,799
2,384
2,515
15.8
16.3
15.3
19.4
25.3
20.0
25.1
21.6
7.8
9.3
1.3
1.2
Interglobe Aviation
Neutral
1,248
-
45,142
21,122
26,005
14.5
27.6
110.7
132.1
11.3
9.5
67.5
48.2
168.5
201.1
2.1
1.7
Jyothy Laboratories
Neutral
377
-
6,855
1,440
2,052
11.5
13.0
8.5
10.0
44.4
37.7
10.8
10.0
18.6
19.3
5.0
3.5
Kirloskar Engines India
Neutral
410
-
5,928
2,554
2,800
9.9
10.0
10.5
12.1
39.0
33.9
16.3
15.4
10.7
11.7
2.0
1.8
Ltd
Linc Pen & Plastics
Neutral
293
-
433
382
420
9.3
9.5
13.5
15.7
21.7
18.6
3.7
3.2
17.1
17.3
1.2
1.1
M M Forgings
Neutral
630
-
761
546
608
20.4
20.7
41.3
48.7
15.3
12.9
86.3
76.4
16.6
17.0
1.2
1.1
Manpasand Bever.
Neutral
796
-
4,556
836
1,087
19.6
19.4
16.9
23.8
47.1
33.4
5.7
4.9
12.0
14.8
5.2
3.9
Mirza International
Neutral
156
-
1,873
963
1,069
17.2
18.0
6.1
7.5
25.4
20.7
3.9
3.3
15.0
15.7
2.2
1.9
MT Educare
Neutral
64
-
255
366
417
17.7
18.2
9.4
10.8
6.9
5.9
1.5
1.3
22.2
22.3
0.6
0.5
Narayana Hrudaya
Neutral
308
-
6,300
1,873
2,166
11.5
11.7
2.6
4.0
116.6
77.8
7.2
6.5
6.1
8.3
3.5
3.0
Navkar Corporation
Buy
216
265
3,085
347
371
43.2
37.3
6.7
6.0
32.4
36.1
2.2
2.0
6.2
10.6
10.0
9.4
Navneet Education
Neutral
184
-
4,286
1,062
1,147
24.0
24.0
6.1
6.6
30.1
27.7
6.2
5.5
20.6
19.8
4.1
3.8
Nilkamal
Neutral
1,934
-
2,886
1,995
2,165
10.7
10.4
69.8
80.6
27.7
24.0
110.5
96.0
16.6
16.5
1.4
1.3
Page Industries
Neutral
16,677
-
18,601
2,450
3,124
20.1
17.6
299.0
310.0
55.8
53.8
371.4
283.5
47.1
87.5
7.6
6.0
Parag Milk Foods
Neutral
216
-
1,815
1,919
2,231
9.3
9.6
9.5
12.9
22.8
16.7
3.6
2.9
15.5
17.5
1.1
0.9
Quick Heal
Neutral
212
-
1,484
408
495
27.3
27.0
7.7
8.8
27.3
24.1
2.5
2.5
9.3
10.6
2.8
2.3
Radico Khaitan
Buy
127
147
1,686
1,667
1,824
13.0
13.2
6.7
8.2
19.1
15.5
1.7
1.6
9.0
10.2
1.4
1.2
Relaxo Footwears
Neutral
490
-
5,880
2,085
2,469
9.2
8.2
7.6
8.0
64.8
61.6
25.1
21.4
17.9
18.8
2.9
2.5
S H Kelkar & Co.
Neutral
282
-
4,078
1,036
1,160
15.1
15.0
6.1
7.2
46.2
39.3
4.9
4.5
10.7
11.5
3.8
3.4
Siyaram Silk Mills
Buy
2,097
2,500
1,966
1,574
1,769
12.5
12.7
97.1
113.1
21.6
18.5
3.3
2.9
15.4
15.5
1.5
1.3
Styrolution ABS India*
Neutral
850
-
1,495
1,440
1,537
9.2
9.0
40.6
42.6
20.9
20.0
53.5
48.6
12.3
11.6
1.0
0.9
Surya Roshni
Neutral
295
-
1,294
3,342
3,625
7.8
7.5
17.3
19.8
17.1
14.9
32.4
26.0
10.5
10.8
0.6
0.6
Team Lease Serv.
Neutral
1,329
-
2,272
3,229
4,001
1.5
1.8
22.8
32.8
58.4
40.5
6.3
5.4
10.7
13.4
0.6
0.5
The Byke Hospitality
Neutral
190
-
760
287
384
20.5
20.5
7.6
10.7
24.9
17.7
5.2
4.2
20.7
23.5
2.7
2.0
Transport Corporation of
Neutral
304
-
2,324
2,671
2,911
8.5
8.8
13.9
15.7
21.9
19.4
3.0
2.7
13.7
13.8
1.0
0.9
India
Stock Watch
June 23, 2017
Company Name
Reco
CMP
Target Mkt Cap
Sales ( Čcr )
OPM(%)
EPS (Č)
PER(x)
P/BV(x)
RoE(%)
EV/Sales(x)
(Č)
Price ( Č)
( Č cr )
FY17E FY18E FY17E FY18E FY17E FY18E FY17E FY18E FY17E FY18E FY17E FY18E FY17E FY18E
zOthers
TVS Srichakra
Neutral
4,013
-
3,072
2,304
2,614
13.7
13.8
231.1
266.6
17.4
15.1
450.9
355.0
33.9
29.3
1.3
1.2
UFO Moviez
Neutral
414
-
1,142
619
685
33.2
33.4
30.0
34.9
13.8
11.9
1.9
1.7
13.8
13.9
1.6
1.2
Visaka Industries
Neutral
509
-
808
1,051
1,138
10.3
10.4
21.0
23.1
24.2
22.0
65.2
61.1
9.0
9.2
1.0
1.0
VRL Logistics
Neutral
331
-
3,024
1,902
2,119
16.7
16.6
14.6
16.8
22.8
19.7
5.0
4.4
21.9
22.2
1.7
1.5
VIP Industries
Accumulate
193
218
2,730
1,270
1,450
10.4
10.4
5.6
6.5
34.5
29.7
7.2
6.2
20.7
21.1
2.2
1.9
Navin Fluorine
Buy
3,034
3,650
2,986
789
945
21.1
22.4
120.1
143.4
25.3
21.2
4.1
3.5
17.8
18.5
3.7
3.0
Source: Company, Angel Research; Note: *December year end; #September year end; &October year end; Price as on June 22, 2017
Market Outlook
June 23, 2017
Research Team Tel: 022 - 39357800
DISCLAIMER
Angel Broking Private Limited (hereinafter referred to as “Angel”) is a registered Member of National Stock Exchange of India
Limited,Bombay Stock Exchange Limited and Metropolitan Stock Exchange Limited. It is also registered as a Depository Participant with
CDSL and Portfolio Manager with SEBI. It also has registration with AMFI as a Mutual Fund Distributor. Angel Broking Private Limited is a
registered entity with SEBI for Research Analyst in terms of SEBI (Research Analyst) Regulations, 2014 vide registration number
INH000000164. Angel or its associates has not been debarred/ suspended by SEBI or any other regulatory authority for accessing
/dealing in securities Market. Angel or its associates/analyst has not received any compensation / managed or
co-managed public offering of securities of the company covered by Analyst during the past twelve months.
This document is solely for the personal information of the recipient, and must not be singularly used as the basis of any investment
decision. Nothing in this document should be construed as investment or financial advice. Each recipient of this document should make
such investigations as they deem necessary to arrive at an independent evaluation of an investment in the securities of the companies
referred to in this document (including the merits and risks involved), and should consult their own advisors to determine the merits and
risks of such an investment.
Reports based on technical and derivative analysis center on studying charts of a stock's price movement, outstanding positions and
trading volume, as opposed to focusing on a company's fundamentals and, as such, may not match with a report on a company's
fundamentals. Investors are advised to refer the Fundamental and Technical Research Reports available on our website to evaluate the
contrary view, if any.
The information in this document has been printed on the basis of publicly available information, internal data and other reliable
sources believed to be true, but we do not represent that it is accurate or complete and it should not be relied on as such, as this
document is for general guidance only. Angel Broking Pvt. Limited or any of its affiliates/ group companies shall not be in any way
responsible for any loss or damage that may arise to any person from any inadvertent error in the information contained in this report.
Angel Broking Pvt. Limited has not independently verified all the information contained within this document. Accordingly, we cannot
testify, nor make any representation or warranty, express or implied, to the accuracy, contents or data contained within this document.
While Angel Broking Pvt. Limited endeavors to update on a reasonable basis the information discussed in this material, there may be
regulatory, compliance, or other reasons that prevent us from doing so.
This document is being supplied to you solely for your information, and its contents, information or data may not be reproduced,
redistributed or passed on, directly or indirectly.
Neither Angel Broking Pvt. Limited, nor its directors, employees or affiliates shall be liable for any loss or damage that may arise from
or in connection with the use of this information.